top-logo.png

Why now for active US value equities?

BCP Advisory Board member Alex Marshall-Tate
outlines why we think now is the time to consider a return to value.

Spring signals the return of Atlantic puffins to their breeding sites, completing their annual migratory cycle. These migratory patterns are fundamental to their survival, ensuring access to food and a suitable environment to breed their young.

Charting recent patterns in Growth vs. Value

Over several years, a blend of dynamics in the US equity markets has led many investor portfolios to become increasingly growth factor biased, and in turn underexposed to value, negatively and unintentionally impacting portfolio diversification. Strong performance in growth stocks and sectors from mid-2022 onwards, coupled with longer term relative weakness in value stocks for more than a decade, has led to a fundamentally “growthier” tilt and flavour to the US large cap equity market, and measures such as the S&P 500 index.
2902b187-3b1c-41d6-a21d-0eacf4b2eaa9.png

The past 10-year period to 31/03/2025, has seen the Russell 1000 Growth TR USD Index outperform the Russell 1000 Value TR USD Index by over +6.7% per annum (in USD). This material outperformance has led to valuations within thegrowth segments of the US equity market becoming increasingly elevated by historical standards, while many value-oriented segments of the market have continued to trade at a discount to their historical averages.

A key driver supporting the recent success of growth has been the sizeable outperformance of the Magnificent 7 group of stocks – Apple, Microsoft, Alphabet, Amazon, Nvidia, Tesla, and Meta – a cohort of large and mega cap growth companies that dominated returns within the S&P 500 Index during 2024, capturing a significant portion of investor attention and market exuberance at the time.

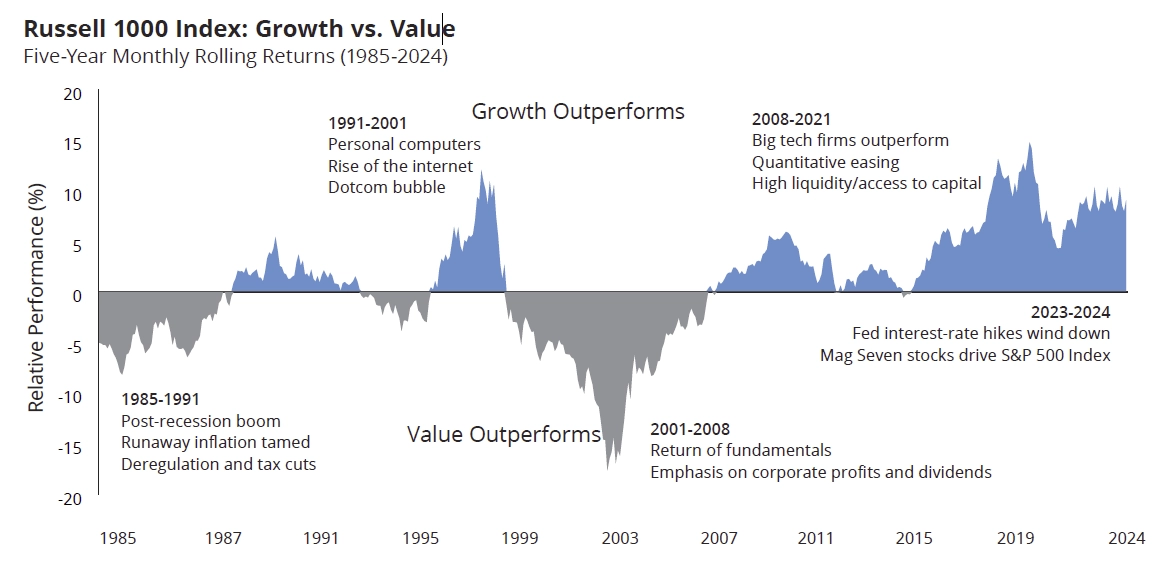
Source: BlackRock, 2025. Past performance is no guide to future performance. BlackRock Fundamental Equities, with data from Refinitiv as of 30/11/2024. Chart shows the representation of growth and value stocks (top quintile of each category) in
the S&P 500 Index across time.

While the strong performance of the Magnificent 7 benefitted many US equity investors in 2024, their success simultaneously also led to heightened levels of stock concentration and single stock risk within many US equity allocations. In a dramatic reversal, Q1 2025 has seen the Magnificent 7 experience significant falls from their recent peak valuations, elevating many of these stocks to key performance detractors within the S&P 500 index and many US equity portfolios. Despite recent share price falls, their continued prominence in the S&P 500 Index still leaves many investors excessively exposed to this group of growth stocks, and growth exposure per se.

A fresh start for Active Value

Against this backdrop, we believe investors should be proactively reviewing their US equity allocations, with a focus on rebalancing and reducing excessive style exposures and concentrations. Furthermore, we believe several factors now support an increase in allocations to actively managed US large cap value equities and strategies
On a forward-looking basis, we anticipate US equity market returns will broaden out and normalise, resulting in an environment more conducive to alpha generation via active stock selection. In conjunction, a structurally more inflationary and higher interest rate environment offers scope for a recovery and relative resurgence in value stocks and sectors going forward – in contrast to the prolonged period of growth outperformance observed since the global financial crisis.
Source: Morningstar and Hartford Funds, 2025. Past performance is no guide to future performance. Actual results may vary. Data as of 31/12/2024. The chart shows the values of the Russell 1000 Growth Index returns minus the Russell 1000 Value Index returns. When the line is above 0, growth stocks outperformed value stocks. When the line is below 0, value stocks outperformed growth stocks. The performance shown above is index performance and is not representative of any Ha rtford Fund’s performance. Indices are unmanaged and not available for direct investment. For illustrative purposes only.
Relative valuations provide a further key consideration. The valuation gap between US growth and value stocks remains historically wide, even factoring in the strong outperformance of value over growth during Q1 2025, and a similar trend seen during more recent US tariff driven market moves. We believe this valuation differential offers attractive relative performance potential for active stock pickers within value segments of the US equity market.
chart-2.png
With large-cap growth stocks in aggregate trading comfortably above their long-term premium relative to large-cap value stocks, this discrepancy presents a potentially compelling opportunity for investors aiming to repositioning their US equity exposures.
Indeed, Q1 2025 has seen US value equities materially outperform US growth equities in aggregate, benefitting investors who proactively rebalanced US equity allocations during H2 2024, reducing growth-factor exposure into strength in favour of value equities.
Source: FTSE/Russell. Analysis by T. Rowe Price. Monthly data from January 1995 to March 2024. Past performance is no guide to future performance. Actual results may vary. The charts shows the relative forward 12-month earnings yield for the Russell 1000 Value Index over the Russell 1000 Growth Index.

The value segment of the US equity market also offers more attractive characteristics in terms of its overall composition. While recent stock concentrations within the S&P 500 have proven challenging for actively managed large-cap growth strategies and large-cap core strategies, large-cap value managers in contrast may be facing an easier to navigate and potentially richer investment opportunity set going forward.

For example, the Russell 1000 Value Index presently comprises 870 stocks, offering an investment universe and opportunity set more than twice as large and diverse as the Russell 1000 Growth Index, which in turn comprises only 394 stocks. The index is also materially less concentrated in terms of its top-10 exposures, alongside demonstrating greater sector diversification compared to the Russell 1000 Growth Index, which remains significantly dominated by Information Technology (58.2%) and Consumer Discretionary (19.4%, notably including Amazon and Tesla)1.
Lastly, recent falls in US stock markets, worsening investor sentiment, and a more fragile global growth outlook, may support a tactical increase in value exposure within US equity portfolios. Historically, value stocks have provided more defensive, lower volatility exposure within equities, due to the higher quality characteristics and more stable earnings profiles of companies typically featured within the value segment of the market. With the outlook for US equity markets expected to remain unclear and volatile going forward, value orientated investment strategies focused on higher quality companies may offer an important and timely addition within a diversified portfolio.

CG River Road US Large Cap Value Select Fund

Market conditions have evolved, presenting what we believe is a compelling investment environment for active large- cap value managers, including the CG River Road US Large Cap Value Select Fund and strategy
CG River Road US Large Cap Value Select offers a compelling investment solution for investors aiming to increase exposure to US large-cap value equities, and seeking to access the attractive investment opportunities within this segment of the US equity market.
Differentiated within its peer group, this US large-cap value strategy presents a strong investment option for investors seeking to diversify and rebalance their US equity allocations, via a genuinely actively managed investment strategy focused on well-managed, financially strong, quality companies trading at compelling prices.

CG River Road US Large Cap Value Select Fund is now available as a UK OEIC, exclusively available through Boutique Capital Partners.

It can be accessed through most major platforms, with fee waivers agreed by Boutique Capital Partners.

Visit our website to find out more about Boutique Capital Partners

Contact: Rodger Kennedy

Boutique Capital Partners is a proud supporter of the Scottish Seabird Centre

¹Based on the composition of each market index as of 28/02/2025.

IMPORTANT INFORMATION

The value of investments and income from them may go down as well as up, and you may not get back the original amount investe d. Any
investments overseas may be affected by currency exchange rates. Past performance is not a reliable indicator of future resul ts and
targets are not guaranteed.

This is a marketing communication. The views and opinions contained herein are as of the date indicated above, are those of author(s) noted above, and may not necessarily represent views expressed or reflected in other communications, strategies or products. These views are as of the date indicated above and are subject to change based on market conditions and other factors. The information herein is believed to be reliable, but Boutique Capital Partners does not warrant its completeness or accuracy. No responsibility can be accepted for errors of fact or opinion. This material is not intended to provide and should not be relied on for accounting, legal or tax advice, or investment recommendations. This document has no regard to the specific investment objectives, financial situation or particular needs of any specific recipient. This document is published solely for informational purposes and is not to be construed as a solicitation or an offer to buy or sell any securities, related financial instruments or advisory services. Figures, unless otherwise indicated, are sourced from Boutique Capital Partners. Boutique Capital Partners has attempted to ensure the accuracy of the data it is reporting, however, it makes no representations or warranties, expressed or implied, as to the accuracy or completeness of the information reported. The data contained in this document is for informational purposes only, and should not be relied upon to make investment decisions. Boutique Capital Partners shall not be liable for any loss or damage resulting from the use of any information contained on this document. This document is not investment research and is available to any investment firm wishing to receive it. The distribution of the information contained in this document in certain jurisdictions may be restricted and, accordingly, persons into whose possession this document comes are required to make themselves aware of and to observe such restrictions.
Distributed in the UK by Boutique Capital Partners Limited, which is an appointed representative of Thornbridge Investment Management LLP (FRN: 713859) which is authorised and regulated by the Financial Conduct Authority (“FCA”) in the United Kingdom and appears on the FCA register under no. 713859.